
View Your Data in a Table
A pivot table displays your data as a table.
1. Identify Your Table Dimensions
All pivot tables have dimensions. The dimensions appear at the top of a pivot table.
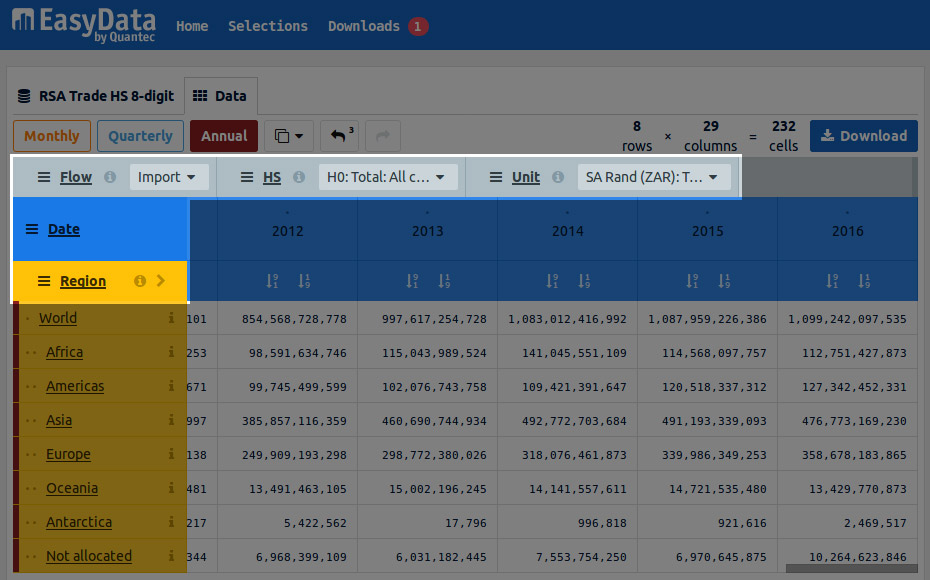
The dimension area appears at the top of a pivot table. This pivot table has 5 dimensions.
A pivot table has three axes, namely the x-axis, the y-axis and the z-axis. Each dimension is positioned on one of these three axes.
X-Axis Dimensions — A pivot table can have one or more dimensions positioned on the x-axis. The x-axis dimension(s) have a blue background. The X-axis dimension items have a lighter blue background and run along the top of the pivot table.

An x-axis dimension.
Y-axis dimensions — A pivot table can have one or more dimensions positioned on the y-axis. Y-axis dimension(s) have a yellow background. The Y-axis dimension items have a lighter yellow background and run down the left-hand side of the pivot table.

A y-axis dimension.
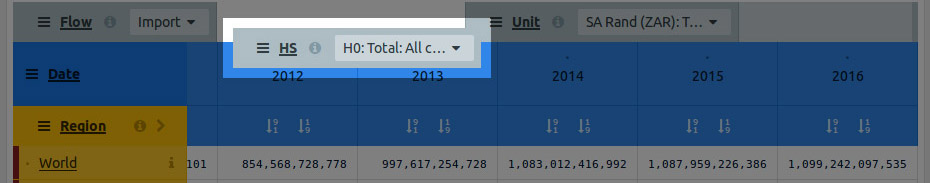
Z-axis dimensions — A pivot table can have zero, one or more dimensions positioned on the z-axis. The z-axis dimensions have a grey background and are displayed above the pivot table. Even though the z-axis dimensions do not appear on the table, their data is included in the calculation of the table's data values. Each dimension on the z-axis has an active dimension item. The name of the active item appears to the right-hand side of a z-axis dimension title.

Z-axis dimensions.
2. Move Dimensions
Dimensions can be moved around to change the way data is displayed on the pivot table.
Dimensions can be dragged and dropped
Example 1: Switch the positions of two dimensions
A dimension on the z-axis (grey) can be switched with a dimension on the y-axis (blue) and vice versa.
Example 2: Switch the positions of two dimensions
A dimension on the x-axis (blue) can be switched with a dimension on the y-axis (yellow) and vice versa.
Example 3: Move additional dimensions onto the y-axis
Additional dimensions can be moved onto the y-axis (yellow) by drag-and-dropping a dimension to the left or right of any dimension already on the y-axis.
Example 4: Move additional dimensions onto the x-axis
Additional dimensions can be moved onto the x-axis (blue) by drag-and-dropping a dimension to the left or right of any dimension already on the x-axis.